File:Mainshum.png: Difference between revisions
From Librivox wiki
Jump to navigationJump to search
(This image shows how to identify the frequency or frequencies of background noise, by selecting a couple of seconds of background noise, and using Analyze | Plot Spectrum in Audacity.) |
(No difference)
|
Latest revision as of 12:49, 24 January 2016
This image shows how to identify the frequency or frequencies of background noise, by selecting a couple of seconds of background noise, and using Analyze | Plot Spectrum in Audacity.
File history
Click on a date/time to view the file as it appeared at that time.
| Date/Time | Thumbnail | Dimensions | User | Comment | |
|---|---|---|---|---|---|
| current | 12:49, 24 January 2016 | 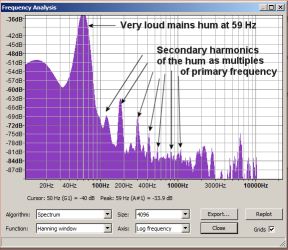 | 288 × 250 (35 KB) | RuthieG (talk | contribs) | This image shows how to identify the frequency or frequencies of background noise, by selecting a couple of seconds of background noise, and using Analyze | Plot Spectrum in Audacity. |
You cannot overwrite this file.
File usage
The following page uses this file: